
Mermaid is a Javascript based diagramming and charting tool that uses Markdown-inspired text definitions and a renderer to create and modify complex diagrams. The main purpose of Mermaid is to help documentation catch up with development. It can be easily be adapted in your git’s repository.
Mermaid is just a great tool, it allows us to create very complete diagrams using a “code” approach. The syntax itself is very easy to learn and provides a very powerful way to have very graphic documentation, especially recommended for well-document your open source projects stored on GitHub, GitLab, Bitbucket, etc… Check a live editor here.
The approach itself is very simple, just add a folder in your repository named docs or your preferred name, it will contain all the project’s documentation. Inside that folder, the main idea is to have another one named diagrams then we will have two more folders: res and src. Res folder contains all the “compiled” diagrams, those are just images and could be SVG, png, or pdf. Check the latest mermaid-cli documentation. Src folder contains all diagrams definitions, all those should be .mmd that indicates that the files contains MermaidJS code. The overall folder tree should be like:
    project/
    |- docs/
       |- diagrams/
          | - res/
          | - src/
Thanks to the mermaid-cli we can compile mermaid code into a raster or vector image that could be added to your website, repository, etc… Let’s see a very simple diagram code example:
server_overview.mmd
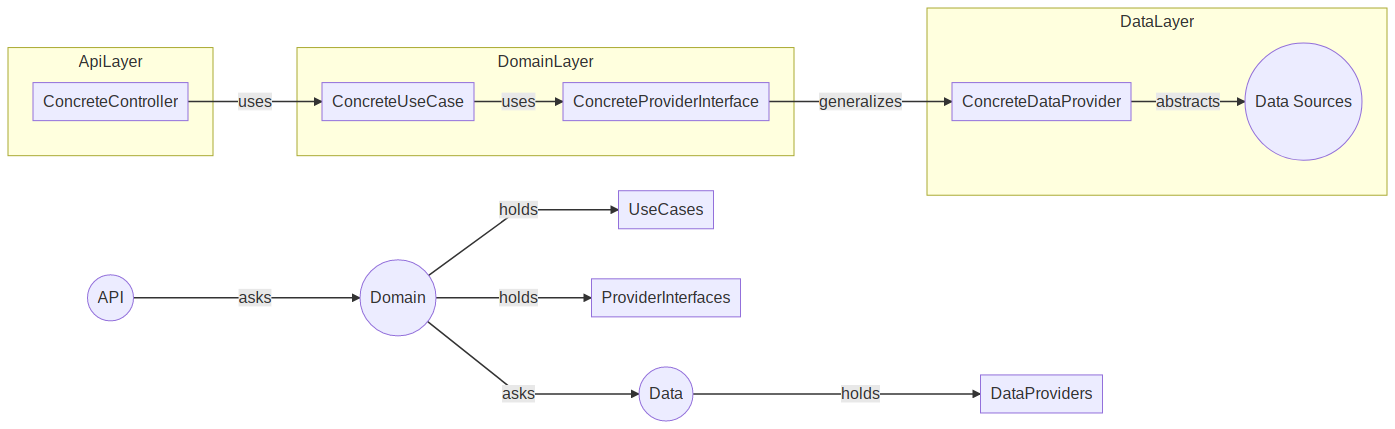
graph LR
      API((API)) -- asks --> Domain((Domain))
      Domain((Domain)) -- asks --> Data((Data))
      Domain((Domain)) -- holds --> UseCases
      Domain((Domain)) -- holds --> ProviderInterfaces
      Data((Data)) -- holds --> DataProviders

      subgraph DataLayer
            ConcreteDataProvider -- abstracts --> Sources((Data Sources))
      end

      subgraph DomainLayer
            ConcreteUseCase -- uses --> ConcreteProviderInterface
            ConcreteProviderInterface -- generalizes --> ConcreteDataProvider
      end

      subgraph ApiLayer
            ConcreteController -- uses --> ConcreteUseCase
      end
The code above will generate the following diagram using the mermaid-cli or the js libriary.
server_overview.mmd.png
Mermaid diagrams includes:
- Graph
- Pie Chart
- Flowchart
- Sequence diagrams
- Class diagrams
- State diagrams
- Entity Relationship Diagrams
- User Journey Diagram
- Gantt
- Directives
Check the documentation for detailed info.
GitHub + Mermaid = ❤️
The integration with the images in GitHub’s READMEs is awesome. In order to add a new image to your README, just add the image URL using the markdown syntax,

This is the regular way to add images in Markdown, however, GitHub allows us just to define a relative path to the resource instead of an absolute path like the previous one. It means that you can add images to a folder in your repository and use then in the READMEs.
For example, if you have a repo like this:
    project/
    | - images/
    |   |- photo.jpg
    | - README.md
You just need to define the relative path to the jpg in order to render it as an image in your README, like:

GitHub will resolve the URL in order to get the RAW content, this is a very useful feature in GitHub!.
You can define a pre-hook script in order to “compile” the mermaid code into images before sending the changes to the remote. You can check a very simple approach in this project, it uses a bash script to regenerate the diagrams.
https://github.com/molayab/dart-media-library-server
How to use?
The usage of the Mermaid CLI is simple, after installed, the command to compile diagrams is mmdc.
▶ mmdc --help
Usage: mmdc [options]

Options:
  -V, --version                                   output the version number
  -t, --theme [theme]                             Theme of the chart, could be default, forest, dark or neutral. Optional. Default: default
                                                  (default: "default")
  -w, --width [width]                             Width of the page. Optional. Default: 800 (default: "800")
  -H, --height [height]                           Height of the page. Optional. Default: 600 (default: "600")
  -i, --input <input>                             Input mermaid file. Required.
  -o, --output [output]                           Output file. It should be either svg, png or pdf. Optional. Default: input + ".svg"
  -b, --backgroundColor [backgroundColor]         Background color. Example: transparent, red, '#F0F0F0'. Optional. Default: white
  -c, --configFile [configFile]                   JSON configuration file for mermaid. Optional
  -C, --cssFile [cssFile]                         CSS file for the page. Optional
  -s, --scale [scale]                             Puppeteer scale factor, default 1. Optional
  -f, --pdfFit                                    Scale PDF to fit chart
  -p --puppeteerConfigFile [puppeteerConfigFile]  JSON configuration file for puppeteer. Optional
  -h, --help                                      display help for command
In order to compile the example above into a png image:
$ mmdc -i server_overview.mmd -o server_overview.mmd.png
For svg or other availble formats, just change the file extension:
$ mmdc -i server_overview.mmd -o server_overview.mmd.svg
Installing in Manjaro/Arch Linux
The installation under Manajaro is pretty simple, there is a package under AUR repository, check https://aur.archlinux.org/packages/mermaid-cli.
Conclusion
Mermaid is a simple but powerful tool that allows us to generate diagrams using a simple syntax. Those diagrams can be easily managed using git. Also, GitHub provides an easy way to use images in your READMEs, using mermaid-cli with GitHub will allow us to create graphical documentation to well-document your projects just defining relative paths to the “compiled” (image) version of your diagram.